10 Important Engagement Metrics for Your OTT Streaming Platform’s Growth
Let’s understand the metrics that matter
Author : Utkarsh Singhal
Date: 30 July 2024
In the highly competitive world of Over-the-Top (OTT) streaming platforms, understanding and leveraging key engagement metrics is critical for sustained growth and user retention. Engagement metrics provide insights into how viewers interact with your content, allowing you to fine-tune your offerings and improve overall user experience. Here, we delve into ten crucial engagement metrics that can significantly impact your OTT platform’s growth.
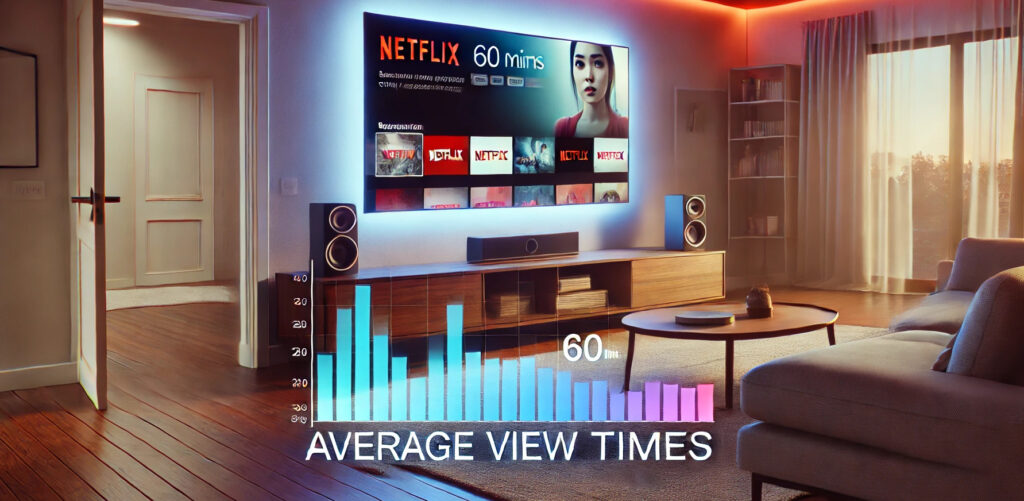
1. Average Viewing Time
Average Viewing Time is a fundamental metric that indicates how long users are watching your content per session. This metric helps you identify the stickiness of your content. High average viewing time typically suggests that viewers find your content engaging and worth watching.
Example: Netflix reports that its viewers spend an average of 62 minutes per day watching content, while Disney+Hotstar claims its users spend 55 minutes per day. (Backlinko).
Strategies to Improve Average Viewing Time:
Create compelling content: Ensure that your shows and movies are captivating from the start to keep viewers hooked.
Implement personalized recommendations: Use AI algorithms to suggest content that aligns with viewers’ interests, keeping them engaged longer.
2. Average Revenue Per User (ARPU)
ARPU measures the revenue generated from each subscriber, indicating the platform’s earning efficiency. A high ARPU suggests a strong monetization strategy, while a low ARPU may indicate a need for pricing or content strategy adjustments.
Example: As of 2024, Netflix’s ARPU in the US and Canada is approximately $16, highlighting its effective monetization strategy, while Indian OTT platforms had an average ARPU of ₹99 in 2023, with Hotstar’s ARPU at ₹120. (Business of Apps) .
Increasing ARPU:
Upselling and cross-selling: Offer add-on packages, premium content, or merchandise to boost revenue per user.
Dynamic pricing: Implement flexible pricing models to cater to different user segments and maximize revenue.
3. Content Completion Rate
Content Completion Rate measures the percentage of users who watch content from start to finish. This metric provides insights into the engagement level of specific content pieces.
Example: Netflix and Disney+ reported that over 80% and 75% of their original series, respectively, are watched to completion, reflecting high content engagement. (Business of Apps)
Increasing Content Completion Rate:
High-quality production: Invest in high production values to create visually and narratively appealing content.
Pacing and structure: Ensure your content is well-paced and structured to maintain viewer interest throughout.
4. Daily Active Users (DAU) and Monthly Active Users (MAU)
DAU and MAU are metrics that measure the number of unique users who interact with your platform daily and monthly, respectively. These metrics are crucial for assessing user engagement and growth trends.
Example: Disney+ reported having 134 million monthly active users as of early 2024, reflecting strong user engagement, while Amazon Prime Video had 60 million MAUs and 25 million DAUs in India in 2023. (Evoca) (Source)
Strategies to Increase DAU and MAU:
Push notifications: Send timely and relevant notifications to encourage regular use.
Engaging content lineup: Schedule regular releases of new episodes, live events, and exclusive content to keep users coming back.
5. Subscriber Growth Rate
Subscriber Growth Rate tracks the increase in the number of subscribers over time. This metric is essential for understanding the overall expansion of your user base.
Example: Netflix added 2.2 million subscribers in Q3 2023, achieving a 10% growth rate, while Amazon Prime Video saw a 12% growth rate in 2023, driven by exclusive new content and international expansion. (Priori Data) .
Boosting Subscriber Growth:
Effective marketing campaigns: Utilize targeted ads and promotions to attract new subscribers.
Offer free trials: Allow potential subscribers to experience your service for free for a limited time to entice them to subscribe.
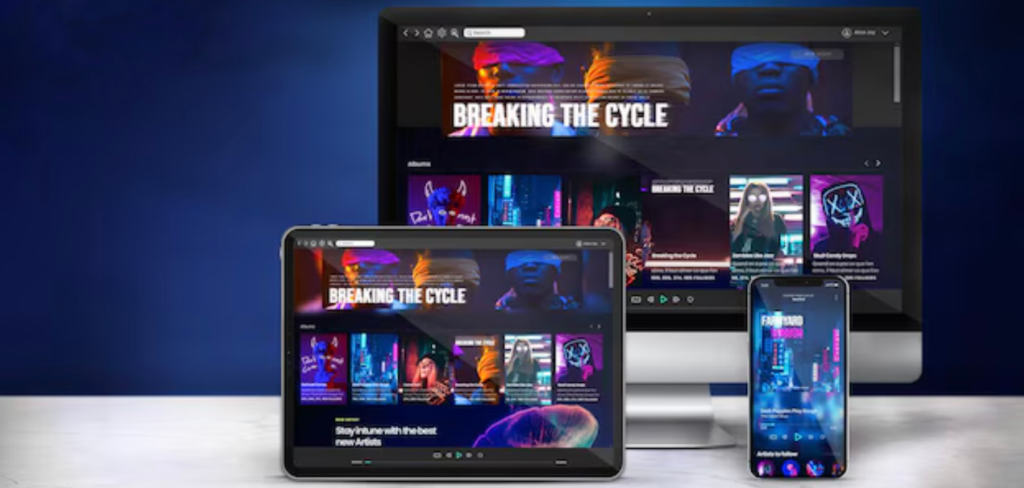
6. Device Distribution
Device Distribution provides data on the types of devices (smart TVs, smartphones, tablets, etc.) your audience uses to access your content. Understanding device preferences can guide your optimization efforts.
Example: Hulu found that 60% of its users prefer watching content on smart TVs, leading to an optimization focus for large screens, while Hotstar reported 60% viewing on mobile, 35% on connected TVs, and 5% on computers. (Evoca)
Optimizing for Device Distribution:
Responsive design: Ensure your platform is optimized for all devices, providing a seamless experience across different screens.
Device-specific features: Tailor features and functionalities to enhance the viewing experience on each type of device.
7. Engagement Depth
Engagement Depth measures how deeply users interact with the platform’s features beyond just viewing content. This includes actions like rating shows, adding to watchlists, sharing content, and using interactive features.
Example: Netflix reports that around 60% of its users engage with interactive features, including creating watchlists, viewing short-form content, and sharing across social media platforms.
Strategies to Increase Engagement Depth:
Encourage Interactions: Prompt users to rate content, add shows to watchlists, and share their favorite movies and series.
Provide Interactive Content: Include features like quizzes, polls, and behind-the-scenes extras to keep users engaged with the platform.
Personalization: Use data analytics to offer personalized content and feature recommendations based on user behavior and preferences.
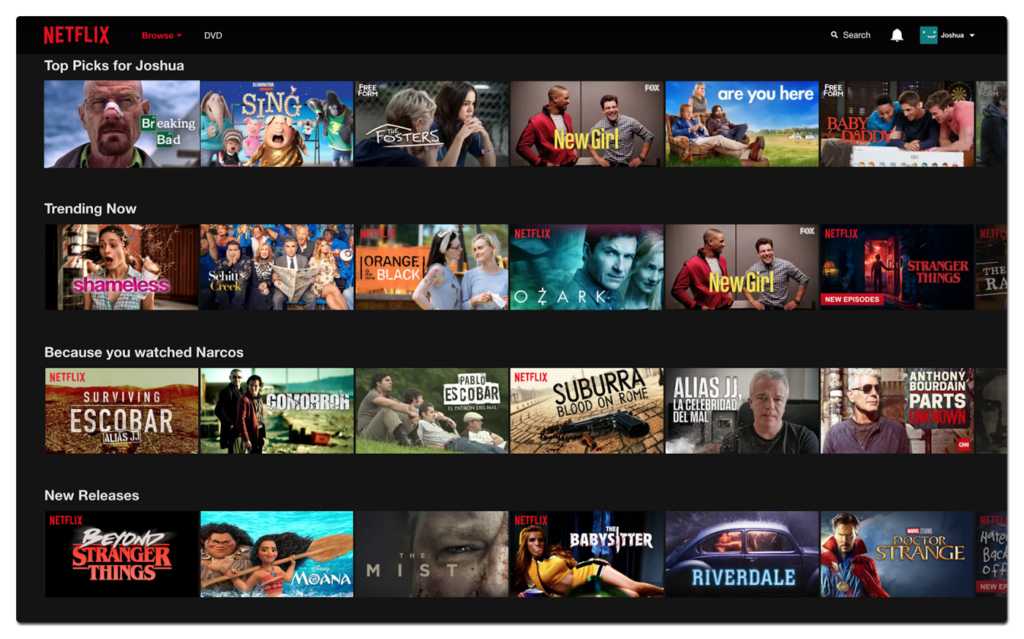
8. Click-Through Rate (CTR) on Recommendations
CTR on Recommendations indicates how often users click on the content recommended to them. A high CTR suggests that your recommendation engine effectively matches content to user preferences.
Example: Amazon Prime Video’s recommendation engine achieved a 20% CTR, demonstrating the effectiveness of its personalized suggestions (Priori Data) .
Improving CTR on Recommendations:
Advanced algorithms: Utilize machine learning to refine your recommendation algorithms continuously.
Personalization: Tailor recommendations based on user behavior, viewing history, and preferences to make them more relevant and appealing.
9. Ad Engagement Rate
The ad engagement rate measures how actively viewers interact with advertisements on the platform. This metric is crucial for evaluating the effectiveness of ad campaigns and optimizing ad revenue.
Example: Disney+’s ad-supported tier had a 20% ad engagement rate in Q3 2023, which is considered strong for video ads, while Indian OTT platforms had an average ad engagement rate of 15% in 2023. (Evoca) .
Strategies to Improve Ad Engagement Rate:
Targeted advertising: Use data analytics to serve relevant ads to specific user segments, increasing the likelihood of engagement.
Interactive ad formats: Incorporate clickable elements, app downloads, or direct purchase options within ads to encourage viewer interaction.
Monitor and adjust: Track ad performance and make data-driven adjustments to optimize ad placements and formats for better engagement.
10. Churn Rate
Churn Rate measures the percentage of users who stop using your service within a given timeframe. A high churn rate can be detrimental to your platform’s growth.
Example: The average OTT churn rate ranges from 5-20%, with Disney+ significantly reducing its churn by introducing popular new series and movies. (Evoca) .
Reducing Churn Rate:
Gather feedback: Regularly solicit user feedback to identify pain points and areas for improvement.
Enhance user experience: Ensure a smooth, bug-free experience with a user-friendly interface and reliable streaming quality.
Conclusion
Understanding and optimizing these 10-engagement metrics can significantly impact the growth and success of your OTT streaming platform. Metrics like Average Viewing Time, Churn Rate, Subscriber Growth Rate, Content Completion Rate, Device Distribution, Subscription Retention Rate, ARPU, and Engagement Depth provide valuable insights into user behavior.
Prioritizing user engagement and satisfaction is crucial for building a loyal user base and achieving long-term success in the highly competitive streaming market.
About Author
Utkarsh Singhal
Utkarsh is a Product Manager with close to 4 years of experience managing B2C and B2B products. He specializes in mobile apps and web platforms, focusing on media & entertainment and Web3 products. Utkarsh’s expertise lies in leveraging technology to enhance user engagement and drive product innovation.
Beyond the tech world, Utkarsh is a coffee connoisseur with a refined palate for various brews and roasts. His passion for thrillers, mystery books and movies fuel his analytical mindset, helping him unravel complex product challenges and craft engaging user experiences.
Thanks for subscribingYou will get notifications for future updates
Welcome cookies
To provide the best experiences, logituit.com use technologies like cookies to store and/or access device information. Consenting to these technologies will allow us to process data such as browsing behaviour or unique IDs on this site. Not consenting or withdrawing consent, may adversely affect certain features and functions.